Performance Report for Tapbit BTC Contract Page
Report Overview
1 background
check the performance of tapbit futures pages ,to see if there is anything can be optmized
browser : chrome on mac Version 131.0.6778.205 (Official Build) (arm64)
device : macbook Air M3
2 Current performance indicators
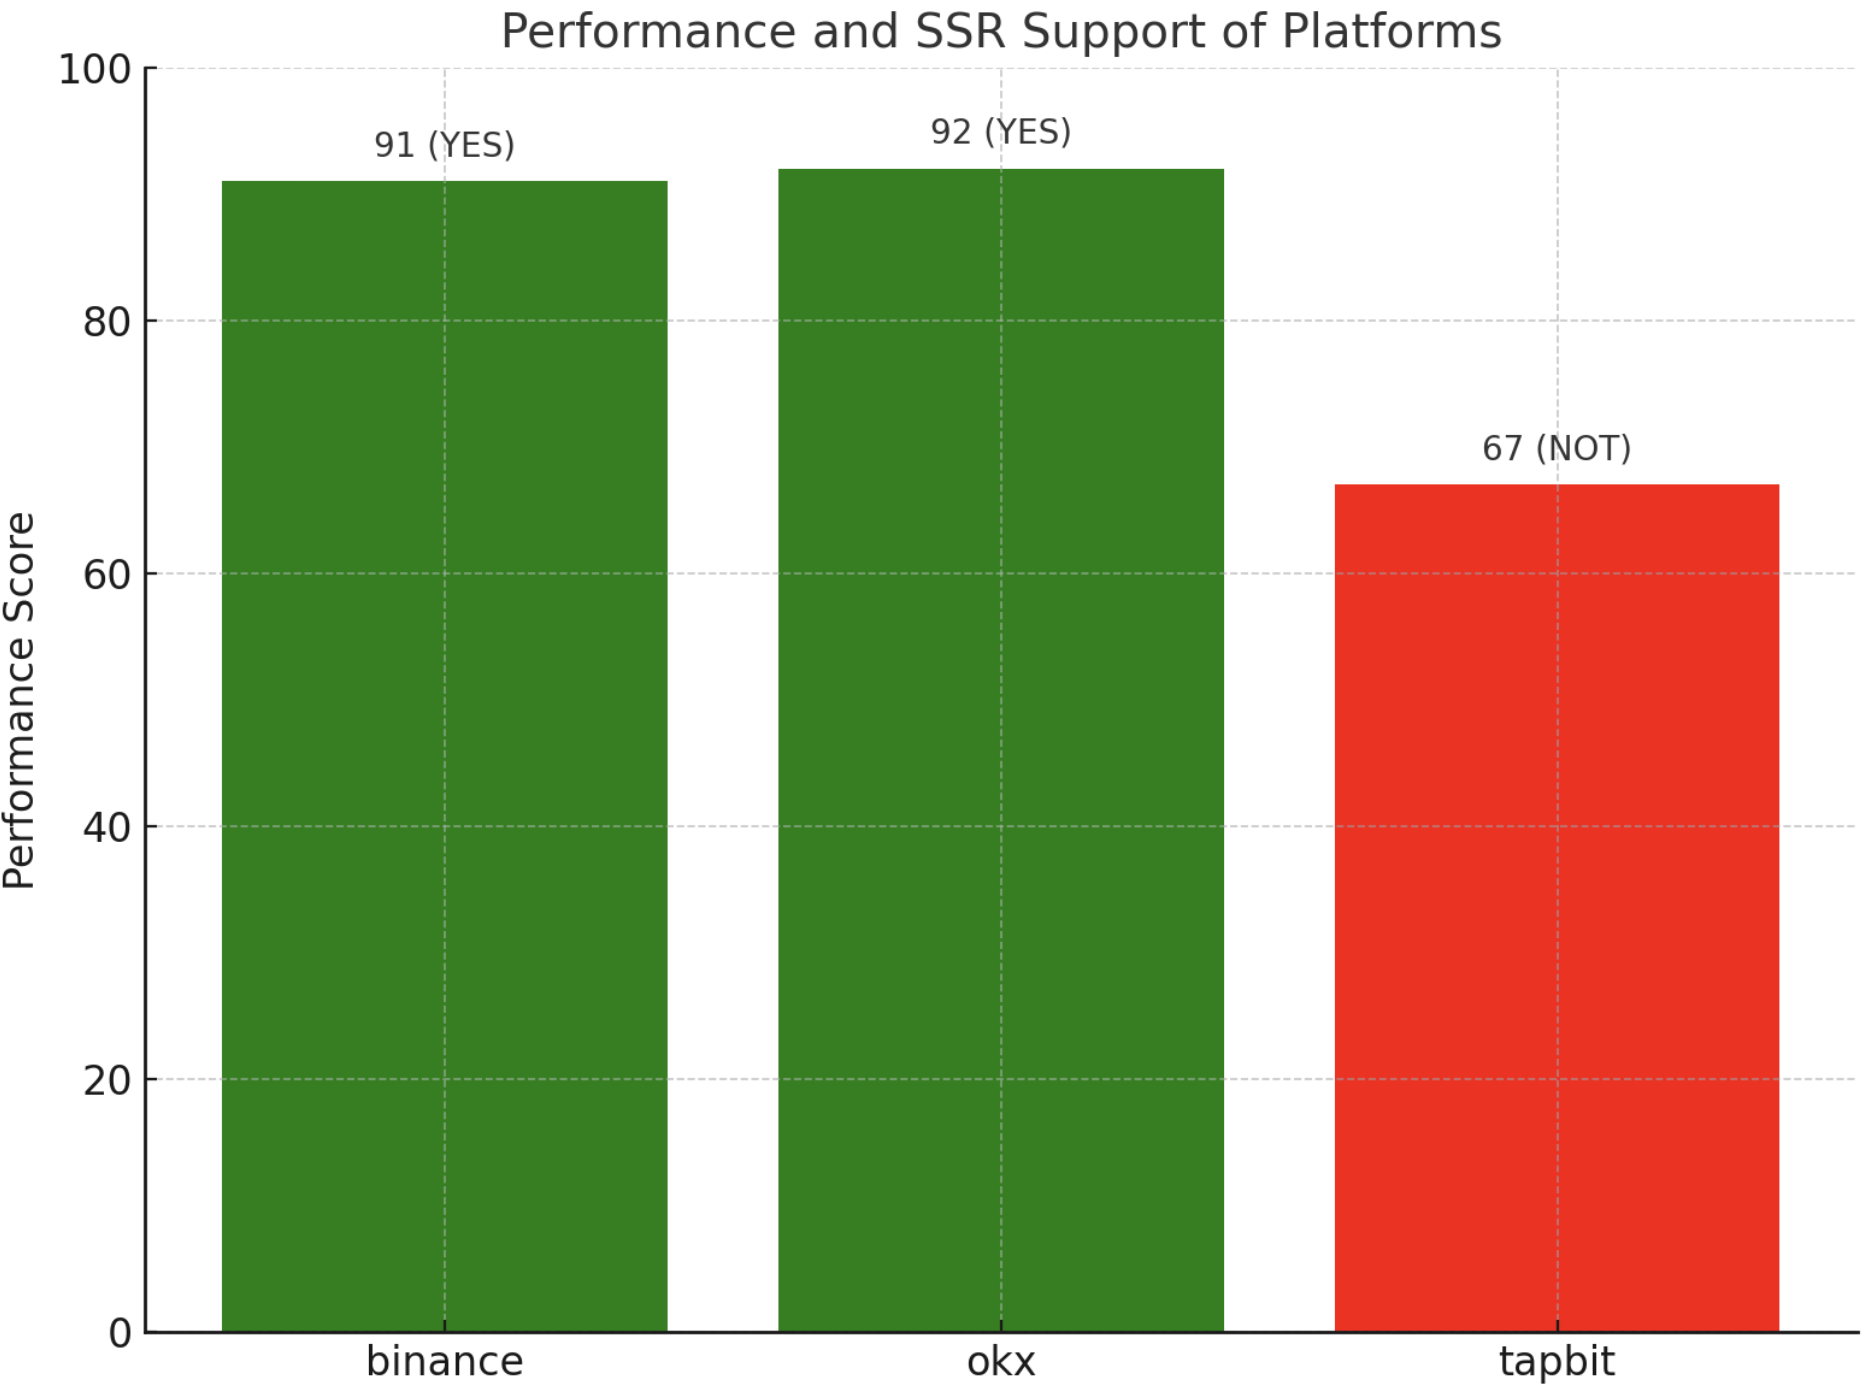
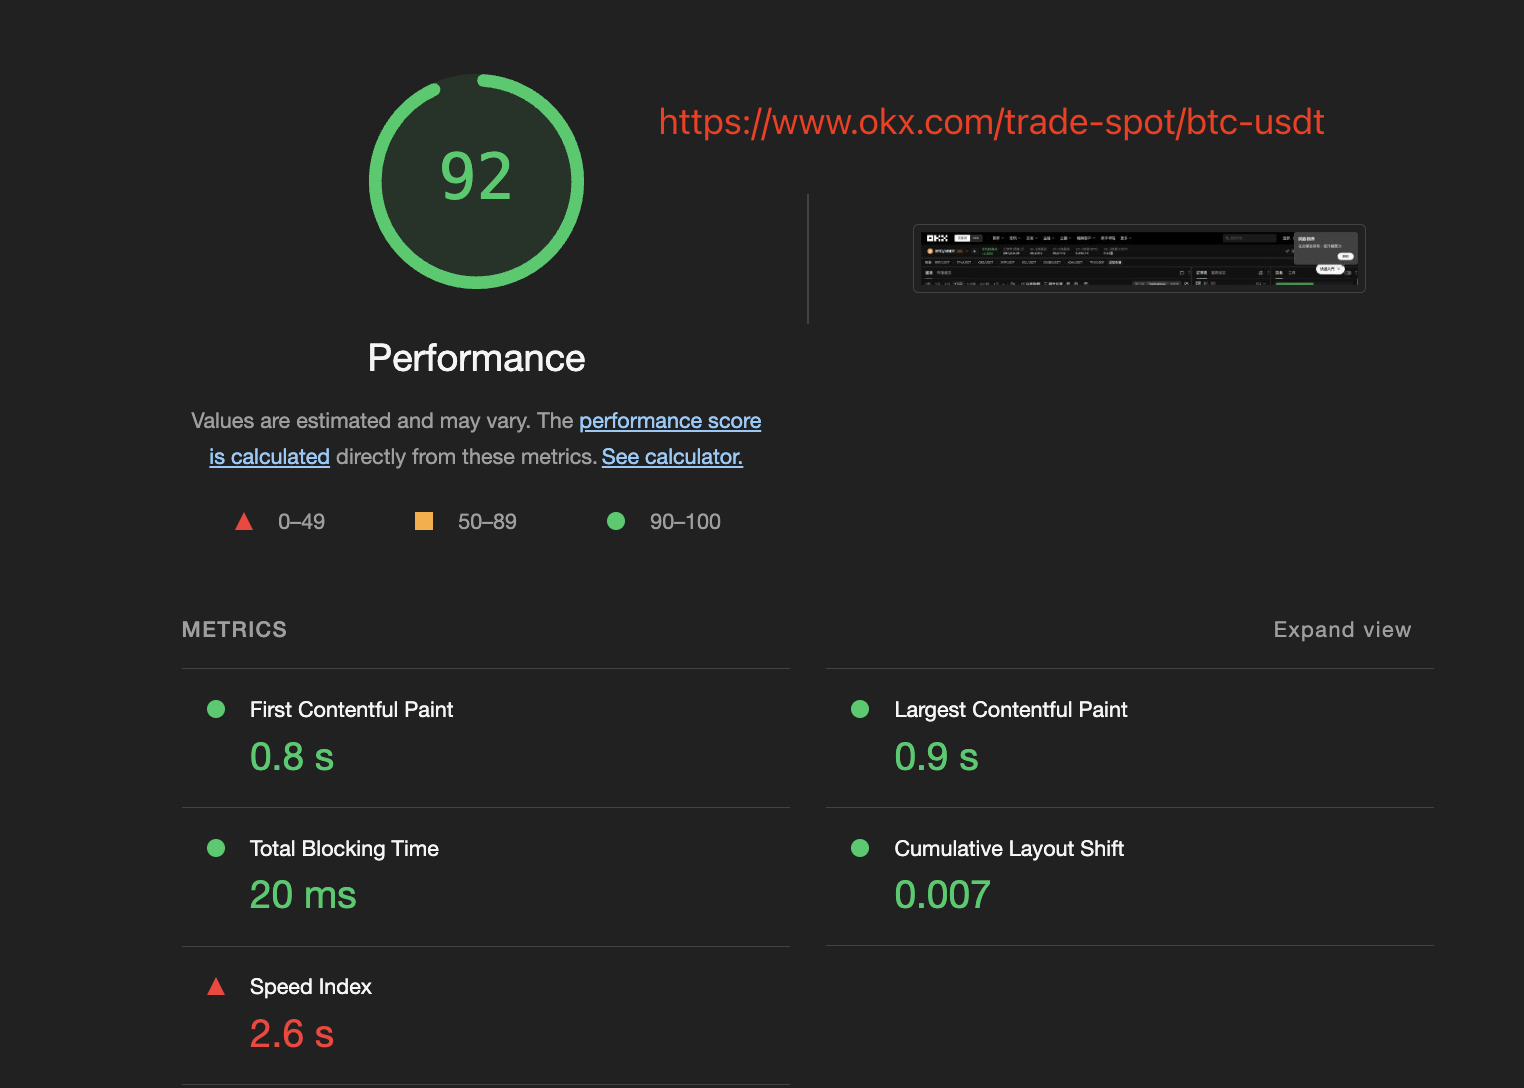
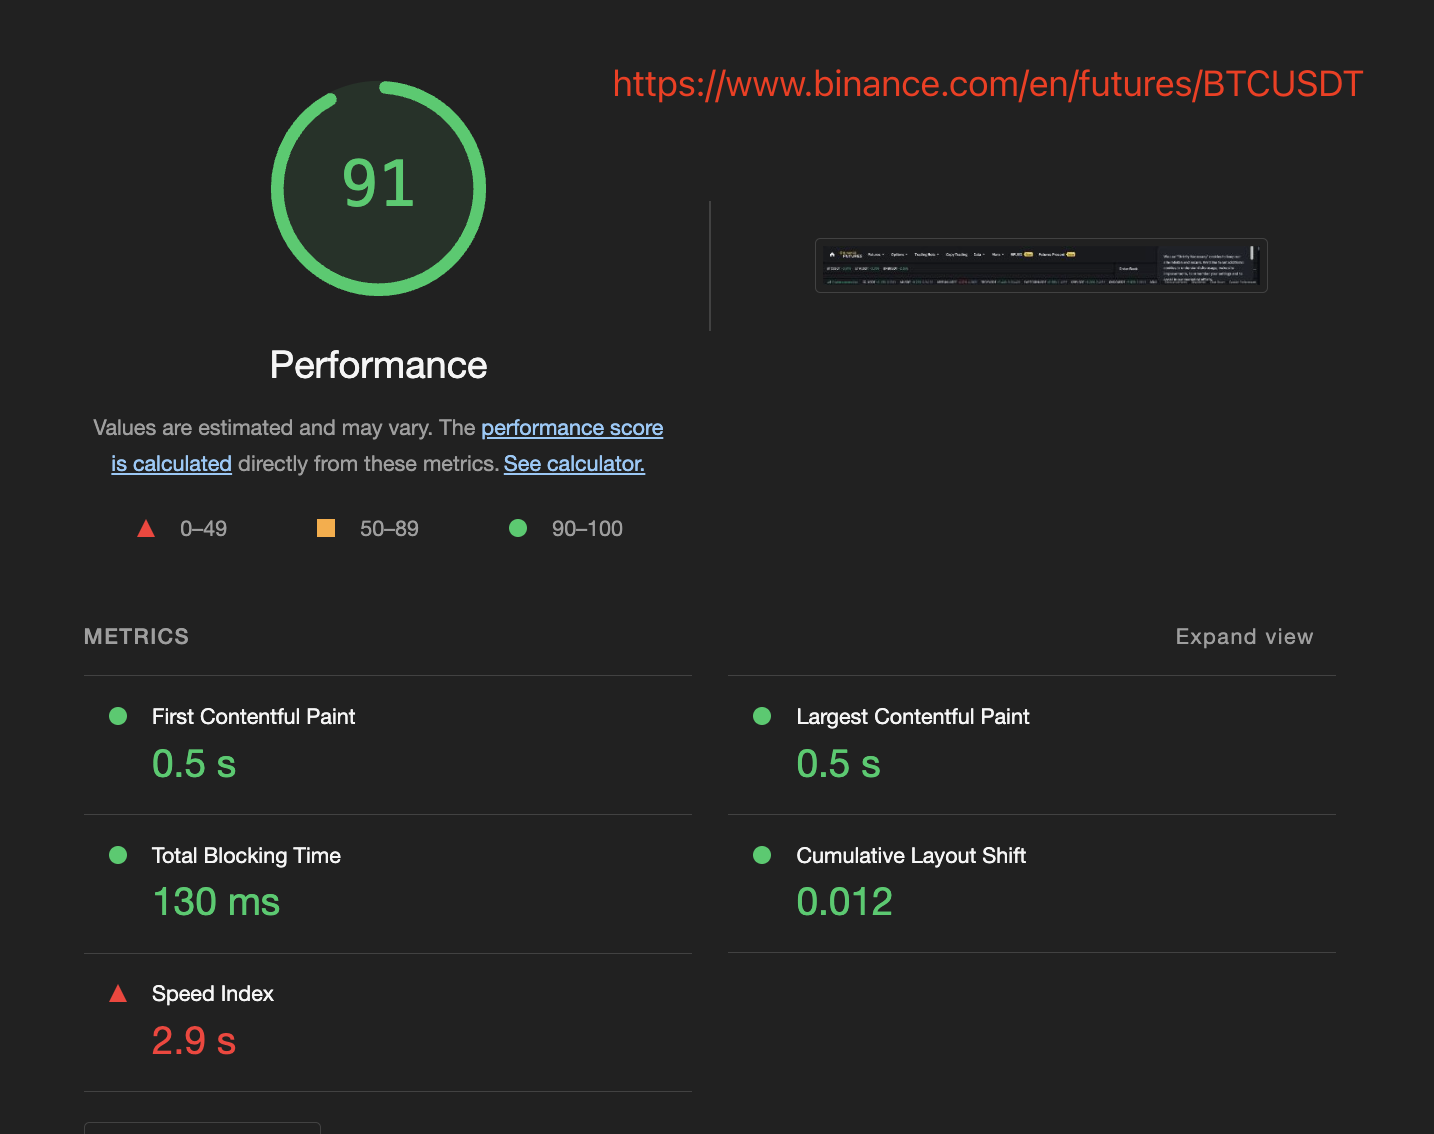
using the tool(WebPageTest and LightHouse in incognito mode)to get the metrics result of binance ,okx and tapbit
| binance | okx | tapbit | |
|---|---|---|---|
| performance | 91 | 92 | 67 |
| SSR | YES | YES | NOT |
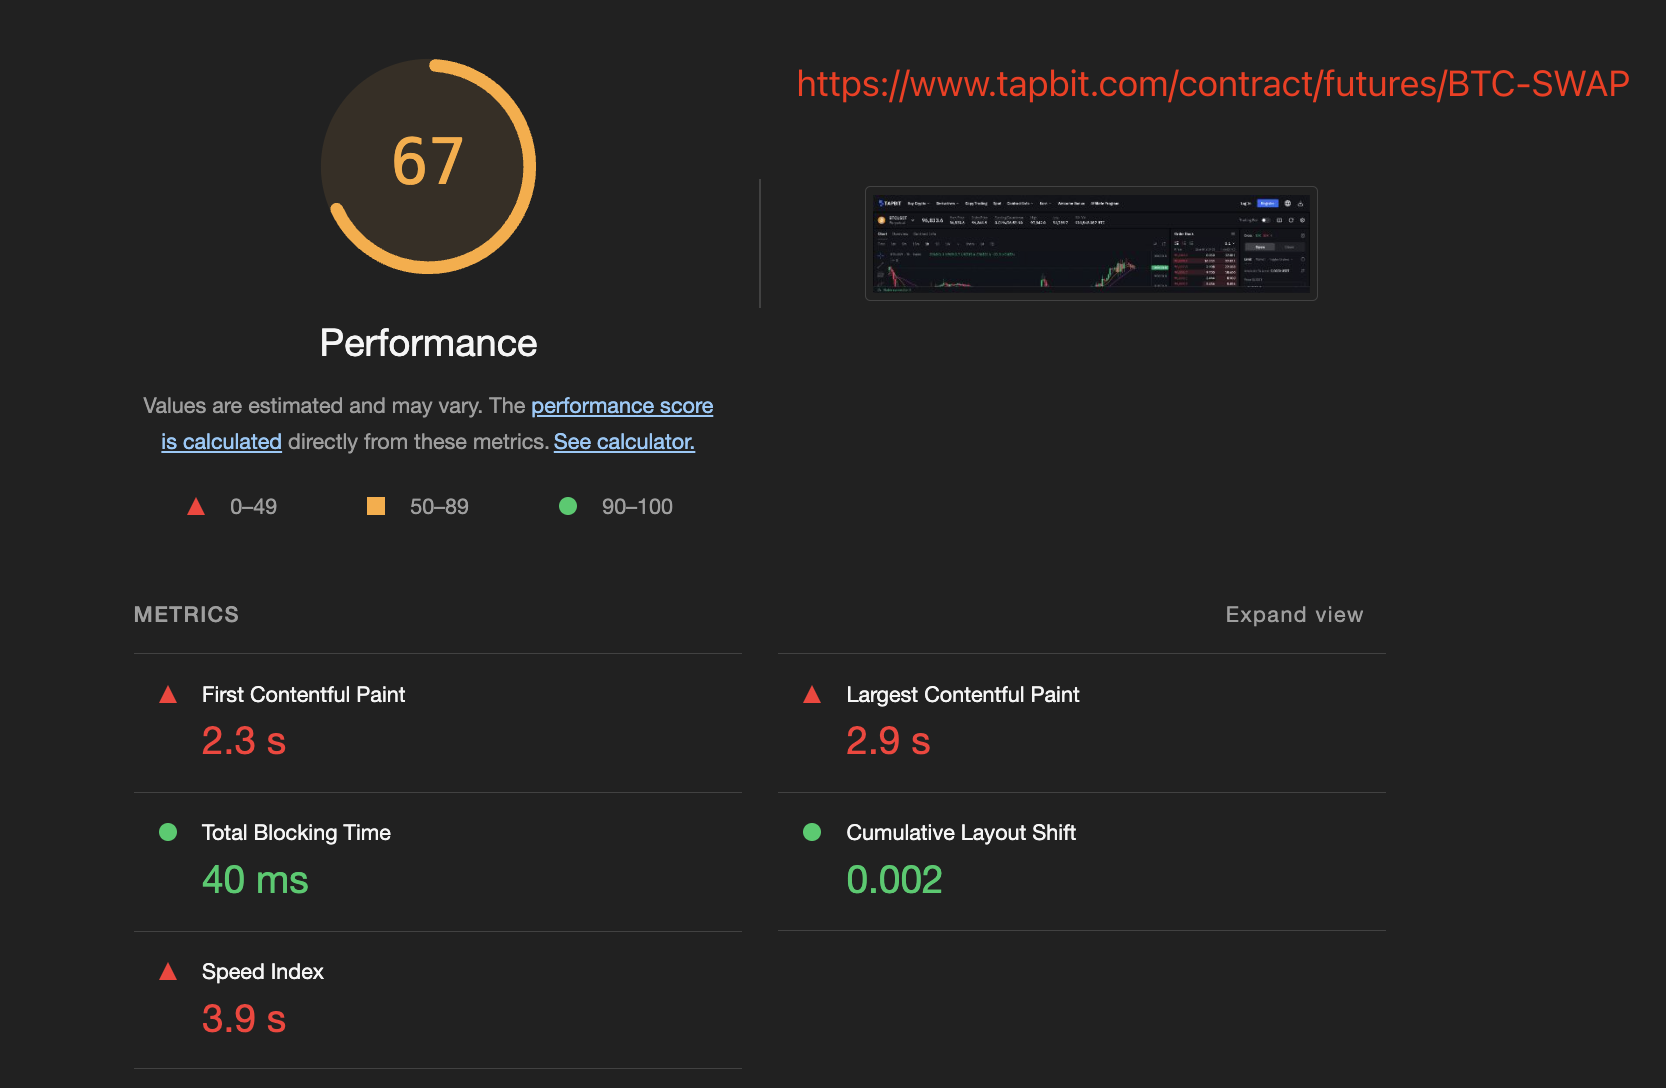
url: https://www.tapbit.com/contract/futures/BTC-SWAP
online result https://www.webpagetest.org/result/250103_AiDcE7_FE/
why SSR(Server-Side Rendering) has better performance score than CSR(Client-Side Rendering),the answer will be in the end of blog.
in the following blog ,we will use the local LightHouse data to talk about tapbit.
First Contentful Paint, FCP : (The first text or image is painted)
2.3 s
the recommended value of FCP is 1.8 s by https://web.dev/articles/fcp#what-is-a-good-fcp-score
Largest Contentful Paint, LCP :(The largest text or image is painted)
2.9 s
the recommended value of LCP is 2.5 s by https://web.dev/articles/fcp#what-is-a-good-fcp-score
Speed Index, SI :(how quickly the contents of a page are visibly populated):
3.9 s
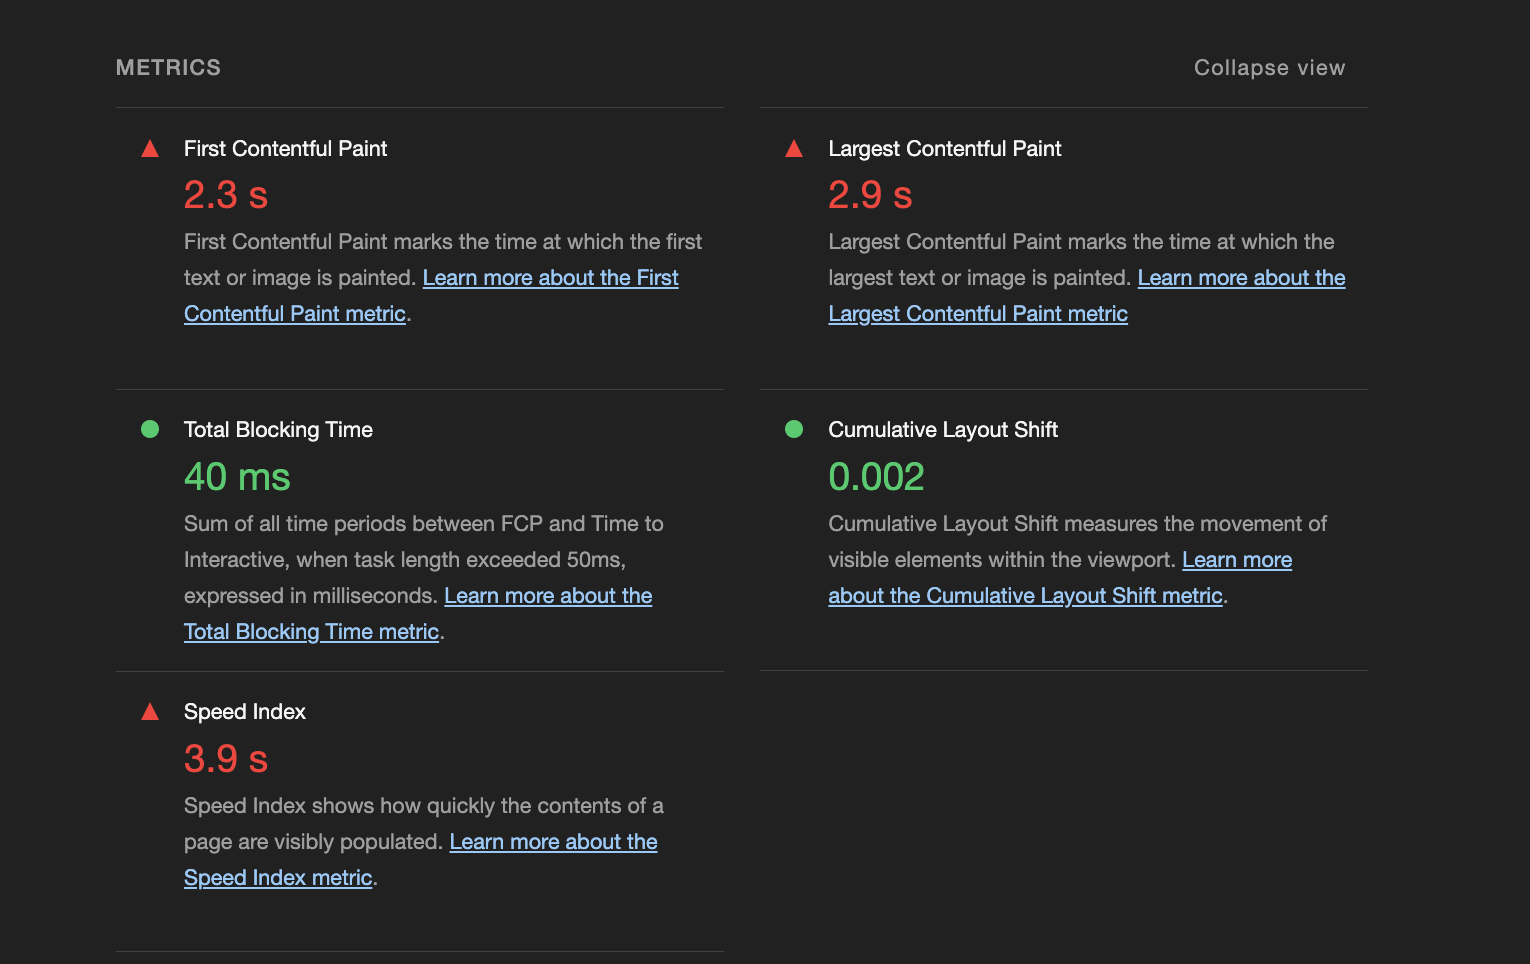
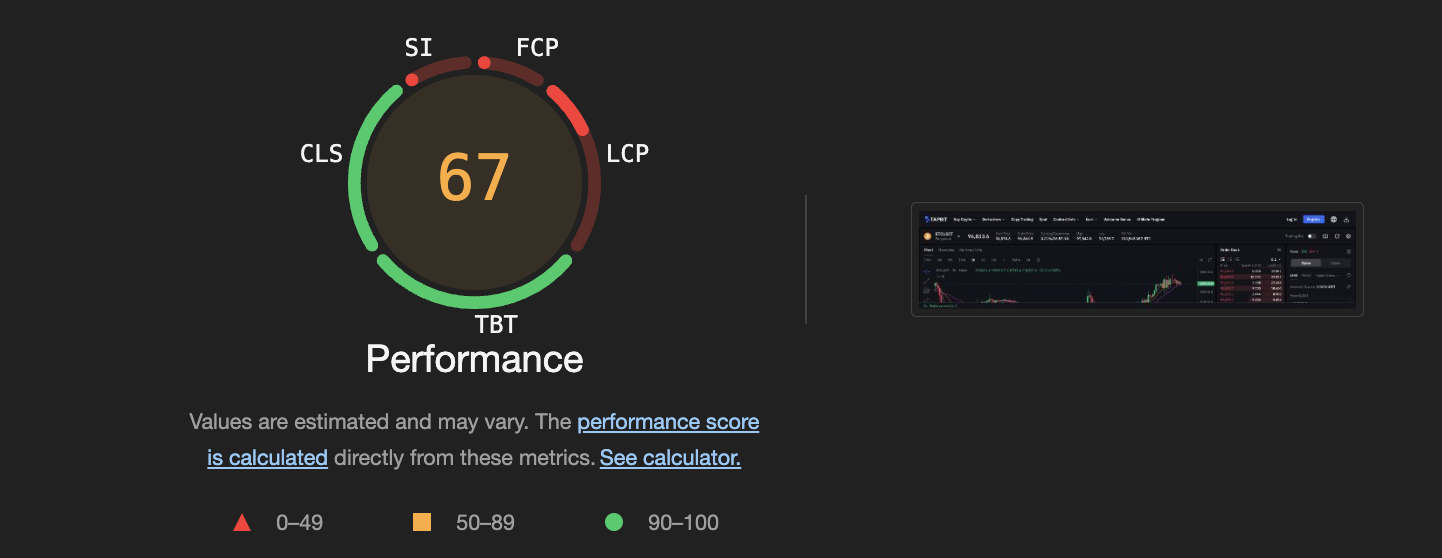
Overall performance rating :
67
3 Optimization suggestions
we can see the LCP and FCP are not in the suggested value.
for FCP && LCP we can do as follows:
Eliminate render-blocking resources
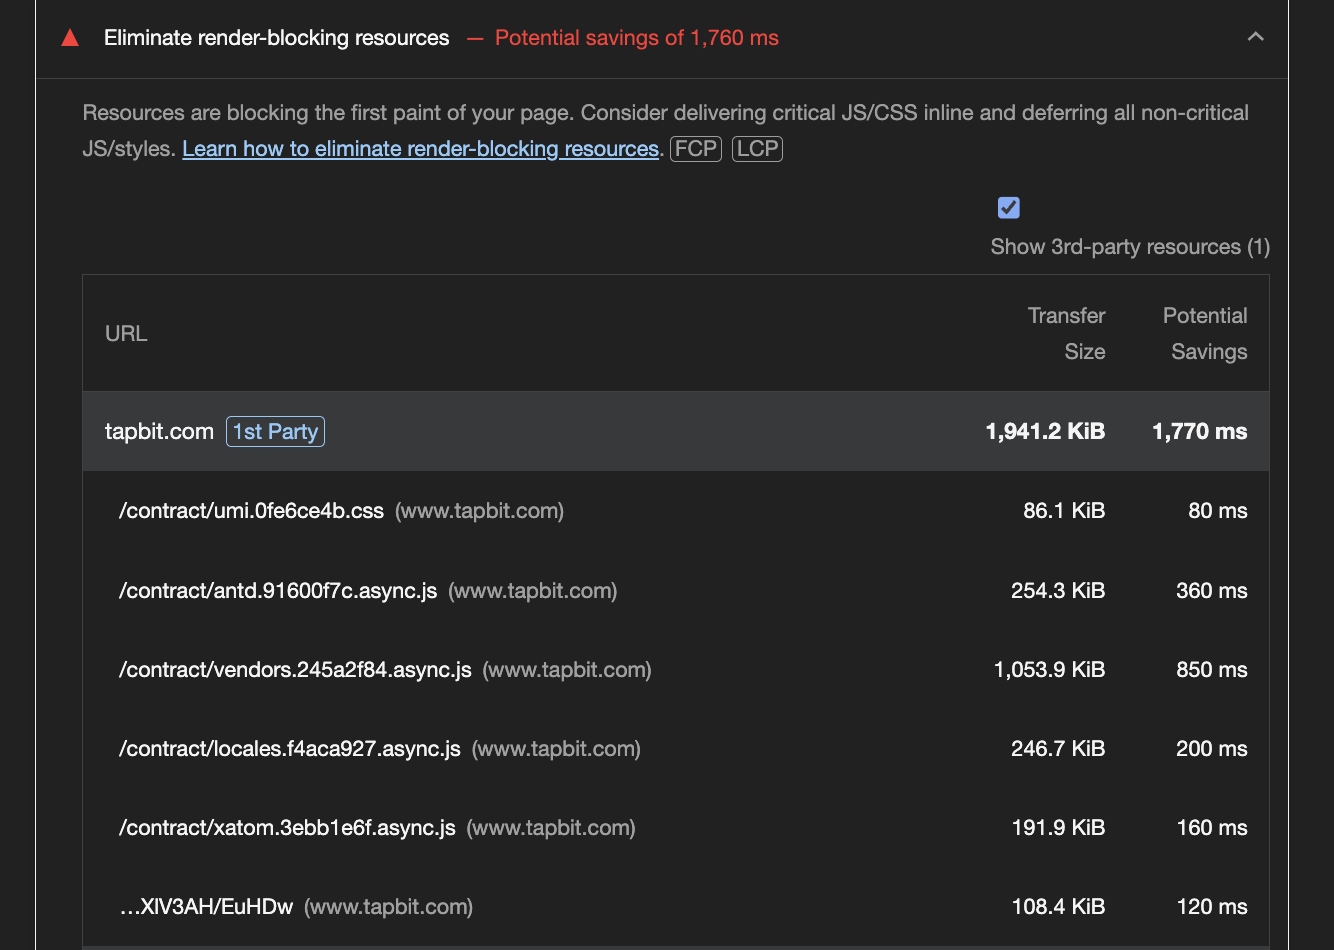
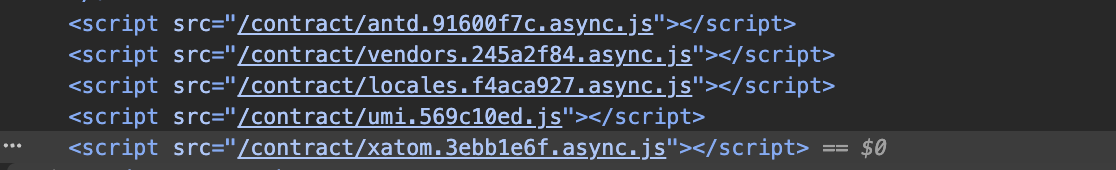
Scripts without the defer attribute block subsequent script execution
as we can see in the network pannel
The total cost Time of the four scripts are 568+731+699+731 which exceeds to 2729 ms ,Optimally, a single script load time of 699ms should suffice under ideal conditions.
The script
https://cdn.tapbit.mobi/libs/googleTag/index.js size is 1kib and blocking is 380 ms
,we can put this script in inline html to reduce the requests and load time.
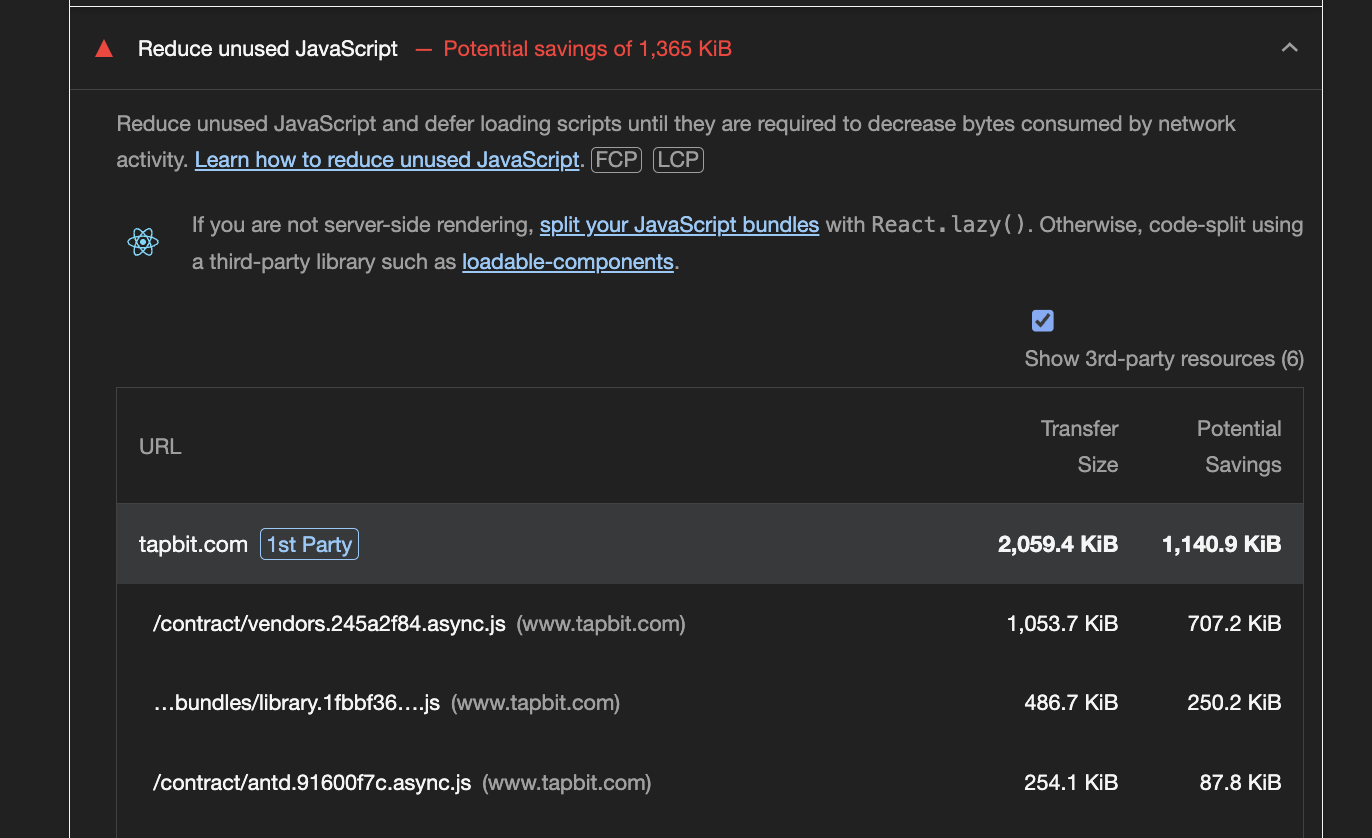
vendorjs’s size has over 1mb . the recommanded size is not greater than 300kb (why 300 kb?)
, try reduce the size by code splitting (code-splitting) or remove unused router . Splitting files allows for the full utilization of HTTP/2’s multiplexing mechanism, reducing JavaScript load time.
Preconnect to required origins
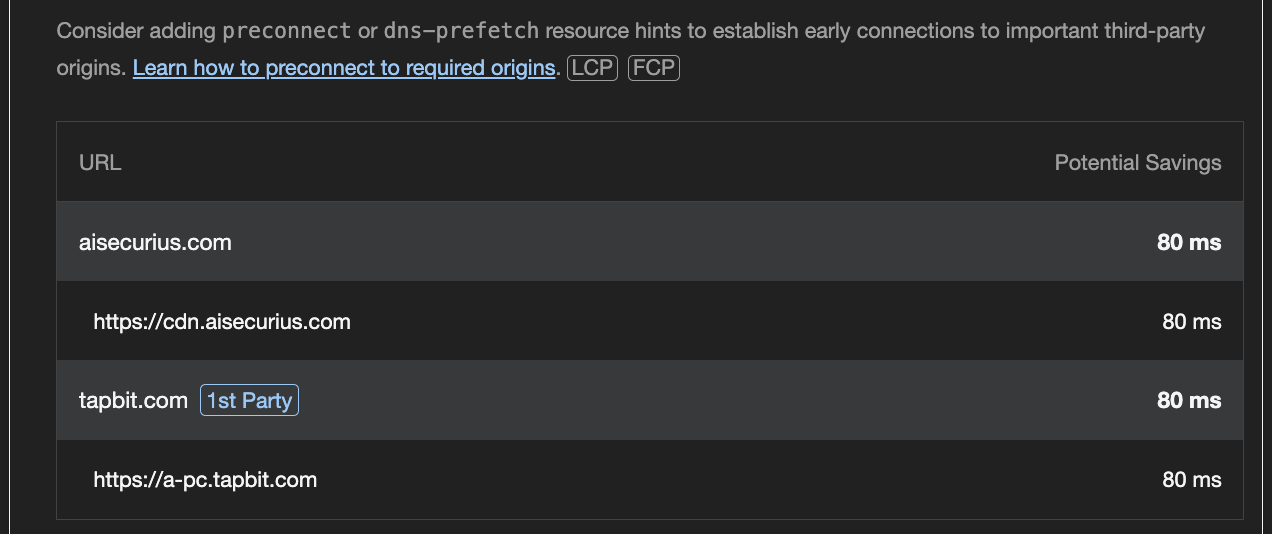
https://cdn.aisecurius.com config dns-prefetch property
https://a-pc.tapbit.com config preconnect property
preconnect
eg. <link rel="dns-prefetch" href="//cdn.aisecurius.com">
<link rel="preconnect" href="https://a-pc.tapbit.com">
besides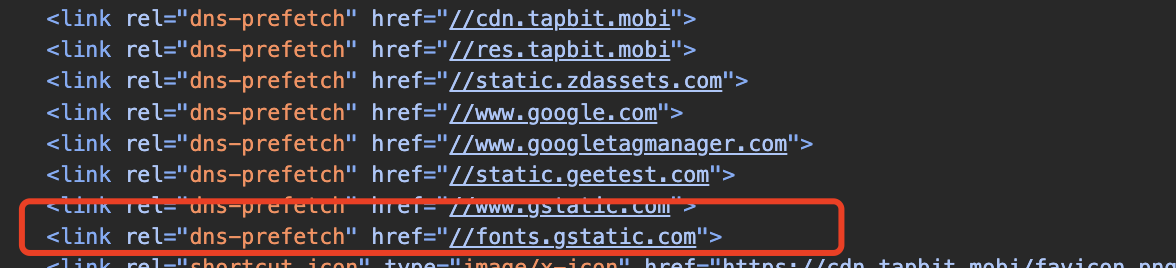
the unused dns-prefetch can be removed .because this will cost extra bandwidth
Reduce unused CSS
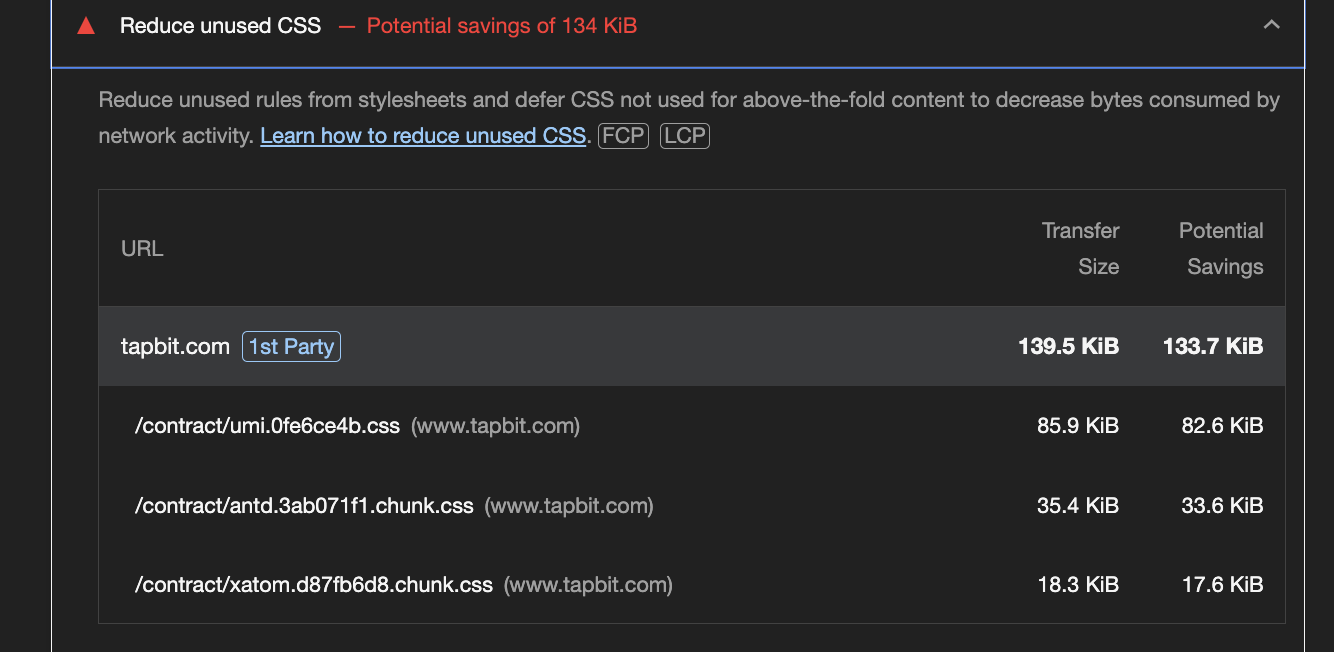
reduce unused css to limit the size of css files ,chrome coverage tools can help a lot
4 Summary and Next Steps
4.1 Performance Monitor
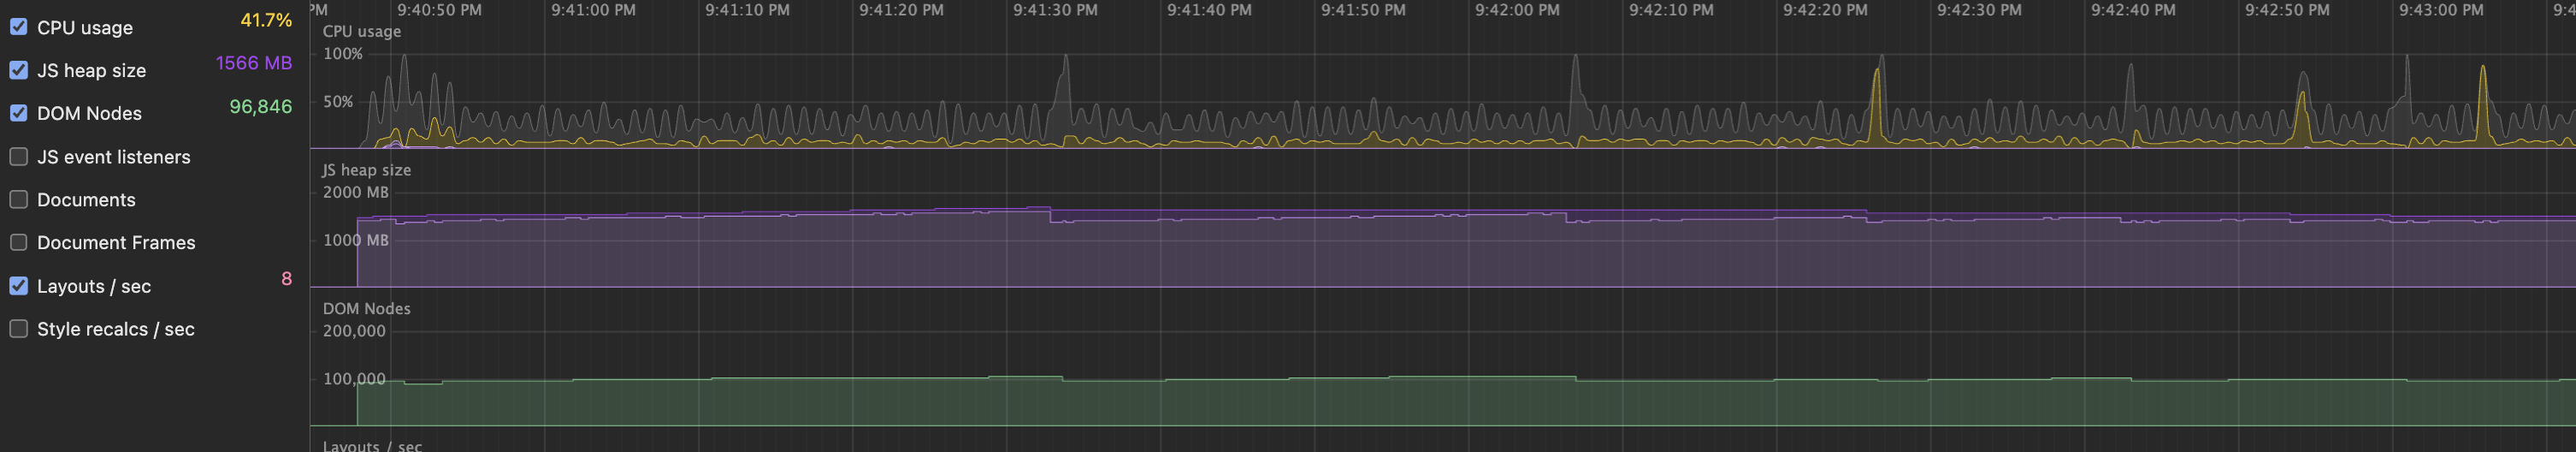
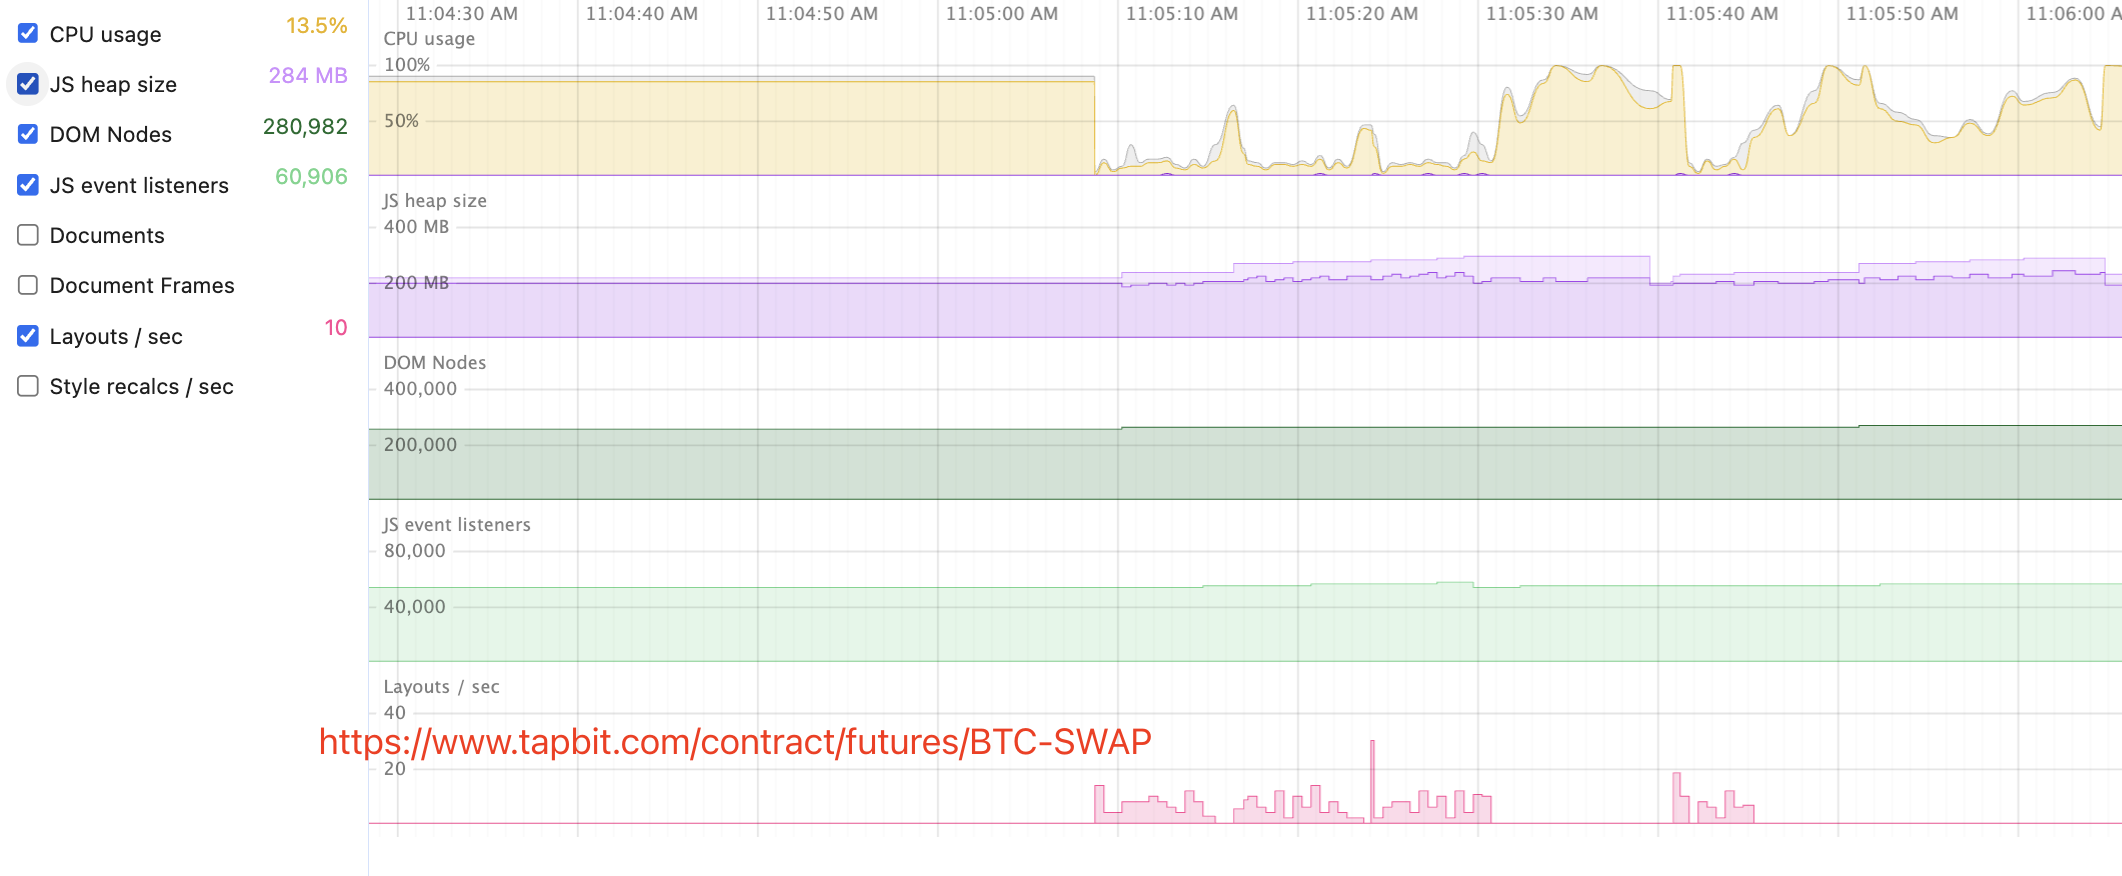
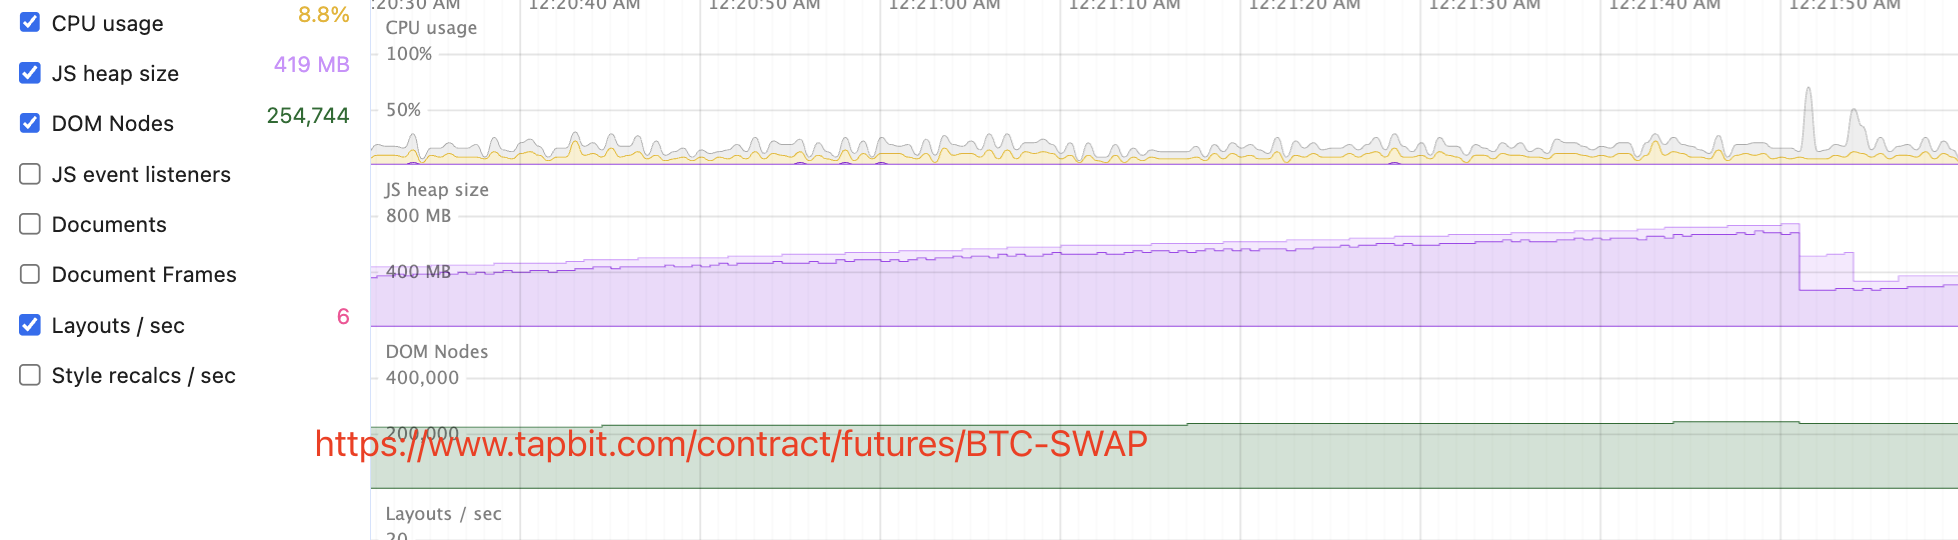
CPU usage is hovering around 50% in the curve, but we haven’t encountered any performance issues yet.
there is one bug When switching to the background, Chrome’s CPU usage spikes to 100%, and it drops back down when switching to the foreground. It could be a Chrome bug or switching to the background, triggered by certain scripts; further investigation is needed to identify the cause.
4.2 browser crash
I encountered several browser crashes while analyzing the webpage ,the error code is 5 or 10.
there are many reasons about crash, such as Extension Conflicts,Hardware Acceleration Issues,Corrupted User Data,Software Conflicts, and Insufficient Resources. As other tabs doesn’t crash, I guess the reason may be out of memory.
open browser ,load page wait for 1 hour
compare the memory usage and nodes
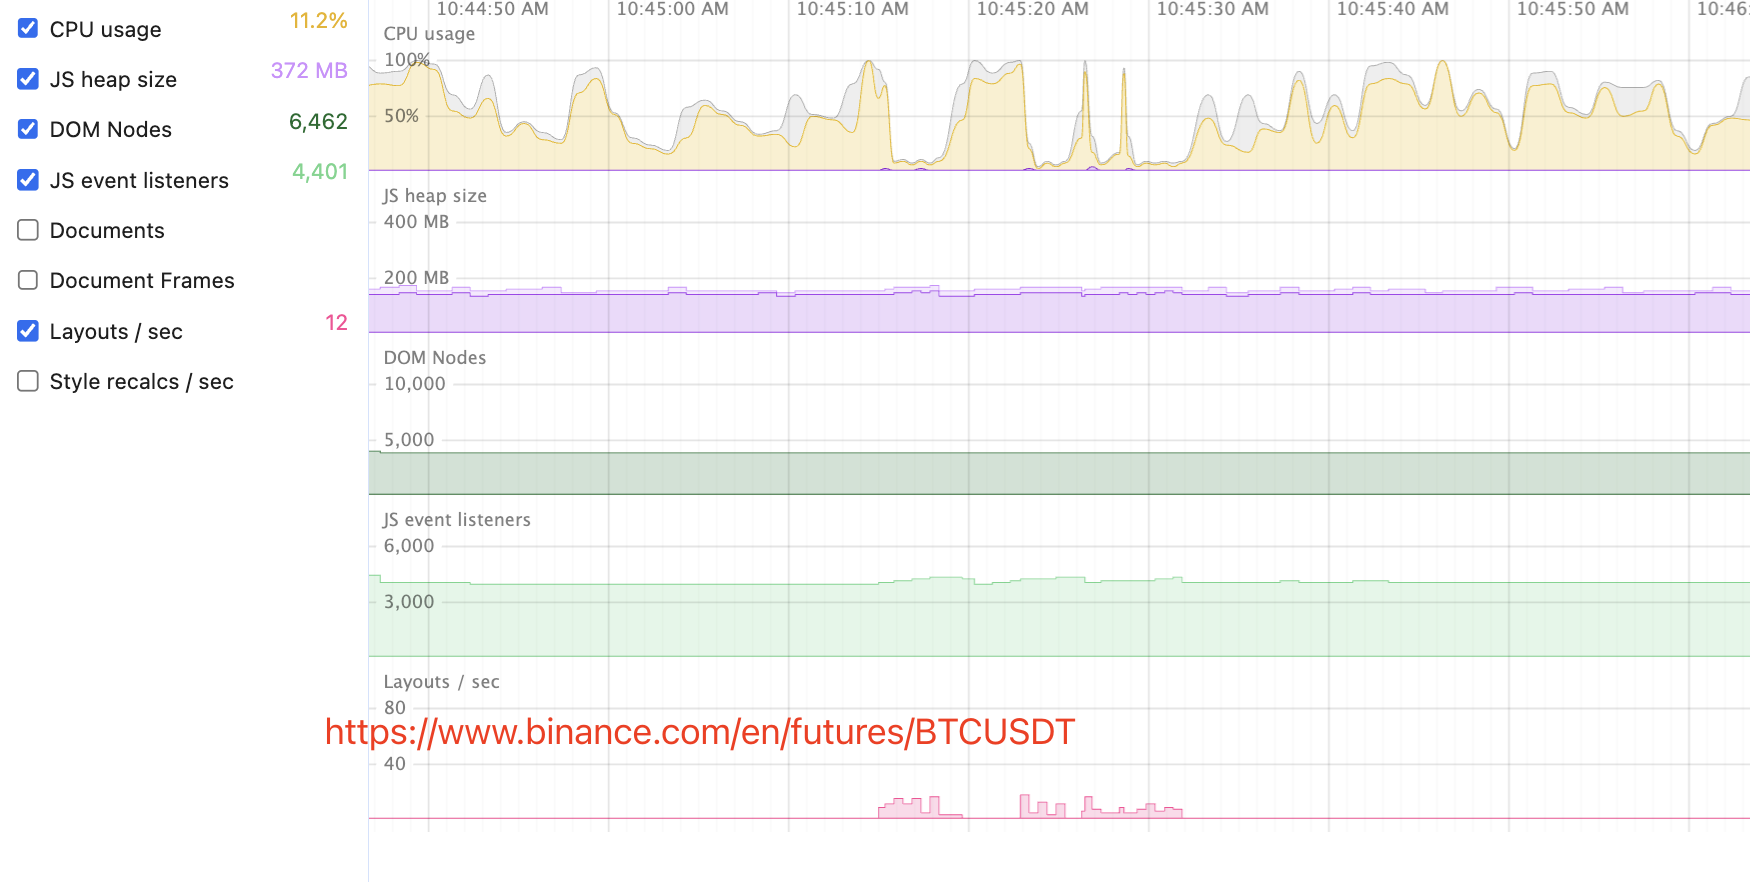
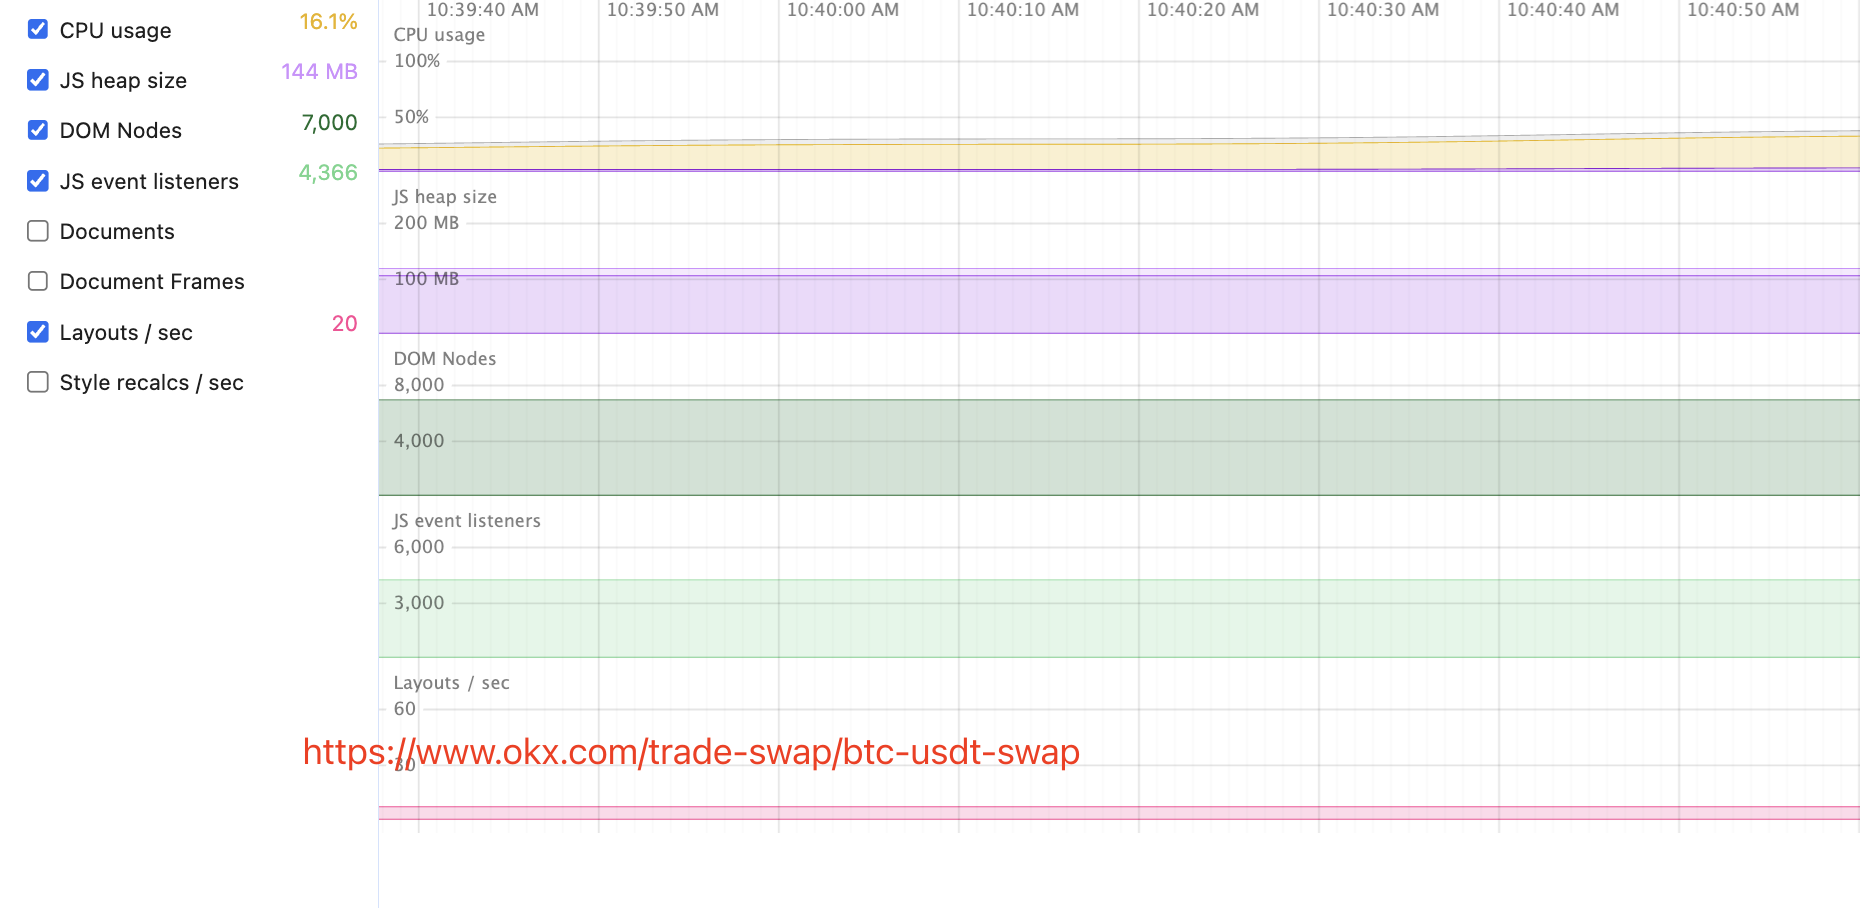
| binance | okx | tapbit | |
|---|---|---|---|
| JS heap size | 372 | 144 | 284 |
| dom nodes | 6462 | 7000 | 280982 |
| JS event listners | 4401 | 4366 | 60906 |
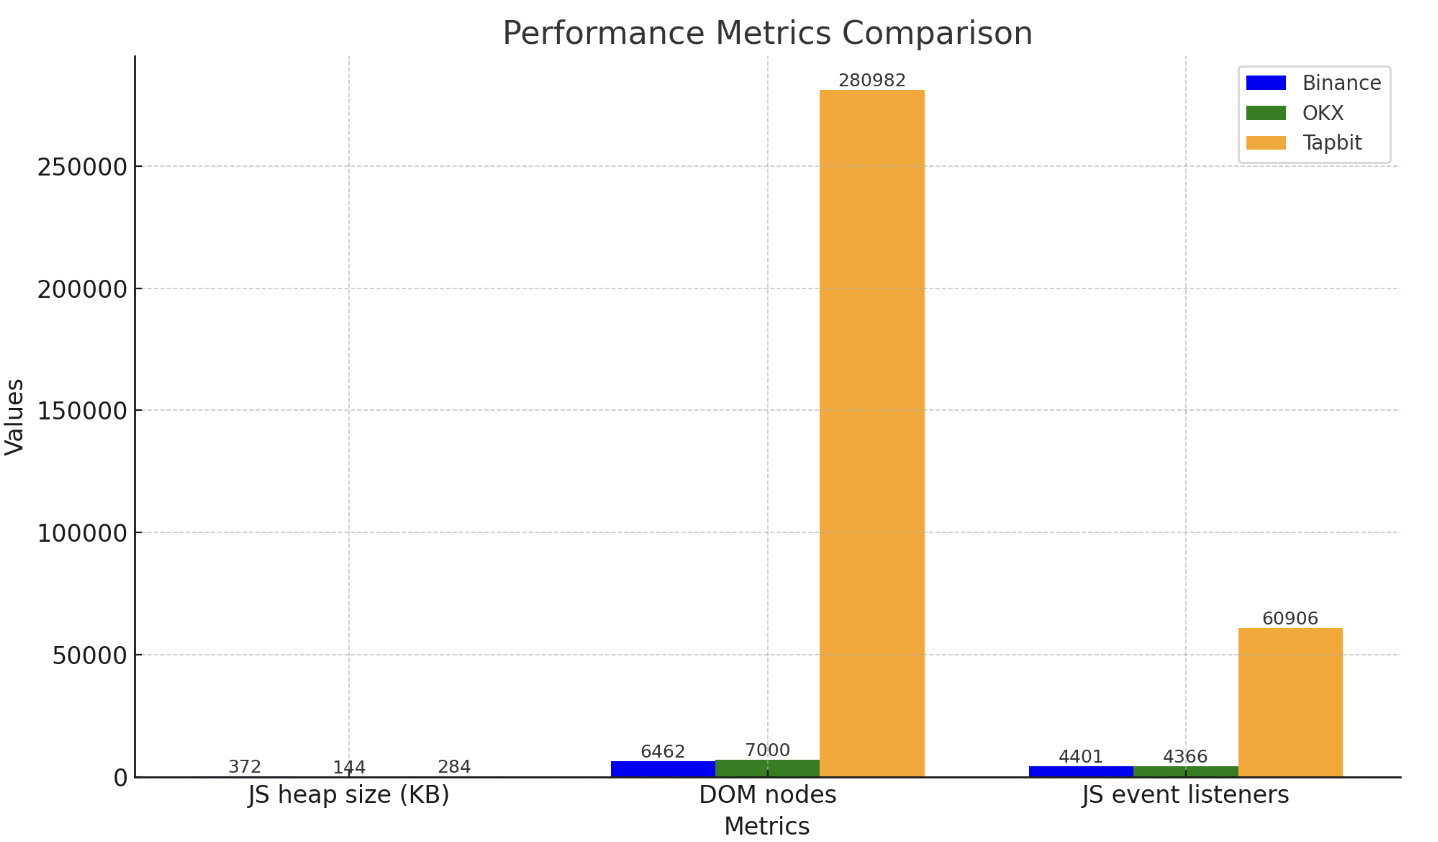
The dom nodes is 43 times of binance .As time goes on, the number of nodes gradually increases. Is this due to invalid renders or duplicate nodes? We need to pinpoint the cause. ,in the curve the JS heap is increasing until 700MB ,may be this is the cause of browser crash. we can use Chrome Heap Profiler to check reason and reduce the unnecessary DOMs or use Virtual DOM.
4.2 images
![]()
The logo’s render size is 85 x 24 px but the img size is 227 x 64 px .this is too large for the render, even for the 2x images .
The other images on the page can use the native solution for lazy loading (async), with updates to follow.
4.3 SSR & CSR
why SSR has better performance score than CSR
In SSR, the server sends a fully rendered HTML page to the browser. This means the browser can start displaying content immediately, providing a faster perceived loading time for the user. In CSR, the browser needs to download and execute JavaScript before rendering any content, leading to a delay.
SSR is better in seo ,because the html and meta tag are easily be readed .but SSR have extra cost for server.
CSR can enable Pre-rendering to get the rendered html.
Comparison of web module versions
| binance | okx | tapbit | |
|---|---|---|---|
| tradingview | TT v27.000 (@ 2024-01-17T15:06:14.900Z) | TT v28.4.0 ( @ 2024-11-29T13:18:46.094Z) | CL v22.032 (@ 2022-07-06T11:53:07.702Z) |
| react | 18.2.0 | 18.3.1 | 16.14.0 |
| sentry | 7.38.0 | 7.74.1 | 8.31.0 |
Based on experience, newer versions generally bring better performance, but the compatibility issues during the upgrade process can result in considerable work. Comprehensive testing is required to ensure quality, which comes with a significant cost. It’s important to weigh these factors before proceeding.
References
SEO Analysis Report
Is SEO limited to TDK? What are the purposes of SEO? What is the relationship between front-end development and SEO? How can we evaluate whether a website’s SEO is well-executed?
Stay tuned for the next article!